|
|
![]() n
episode #50 of this series, I called attention to the IS (Insulated Sheath) card
introduced into NEC-4. The program control command provides a means to factor into a model
the effects of the conductivity and permittivity of insulation wrapped around a wire.
Assuming a high insulating effect--that is, a very low conductivity--the physical
shortening effects of insulation on a wire for a given frequency are functions of the
permittivity (relative dielectric constant) and thickness of the insulation.
n
episode #50 of this series, I called attention to the IS (Insulated Sheath) card
introduced into NEC-4. The program control command provides a means to factor into a model
the effects of the conductivity and permittivity of insulation wrapped around a wire.
Assuming a high insulating effect--that is, a very low conductivity--the physical
shortening effects of insulation on a wire for a given frequency are functions of the
permittivity (relative dielectric constant) and thickness of the insulation.
NEC-4 and IS
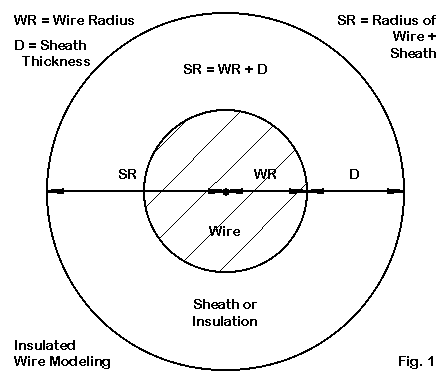
Fig. 1 shows the situation of an insulated wire. For NEC modeling, there are two radii of interest. One is the radius of the conducting wire (WR). The second is the radius of the wire-plus-insulation (SR). The difference in the two radii is the thickness of the insulation (D). In NEC-4, we can enter the required data in the IS command and obtain automatic calculation of the effects of the insulation. By comparing, for example, the resonant length of a bare wire and a wire with a given type and thickness of insulation, we can obtain the velocity factor of the insulated wire in antenna (not in transmission-line) service. See column 50 for some ranges of velocity factors that apply to typical types and depths of insulation.
I do not presently have access to a handy list of relative dielectric constant values for wire insulations that we commonly encounter. One of the few guides available comes from the checking sources like Passive Electronic Component Handbook, 2nd Ed, edited by Charles A. Harper (McGraw-Hill, 1997). The capacitor chapter provides an interesting--although not wholly relevant--list of plastics used as capacitor dielectrics, along with their approximate dielectric constants. Some of these same plastics are used for wire insulation.
Material                                                         Approx. Permittivity
Polyisobutylene                                                                2.2
Polytetrafluoroethylene (PTFE)                                                 2.1
Polyethylene terepthalate (PET)                                                3.0-3.2
Polystyrene (PS)                                                               2.5
Polycarbonate (PC)                                                             2.8-3.0
Polysulfone (PSU)                                                              2.8-3.2
Polypropylene (PP)                                                             2.2
Common plastics, then, appear to have a range of relative permittivity values between 2 and 3. In contrast, the permittivity of a vacuum is by definition 1.0, and air is 1.0006. If we specify a relative permittivity value of 1.0 for any sheath, no matter how thick, we obtain the performance of bare wire.
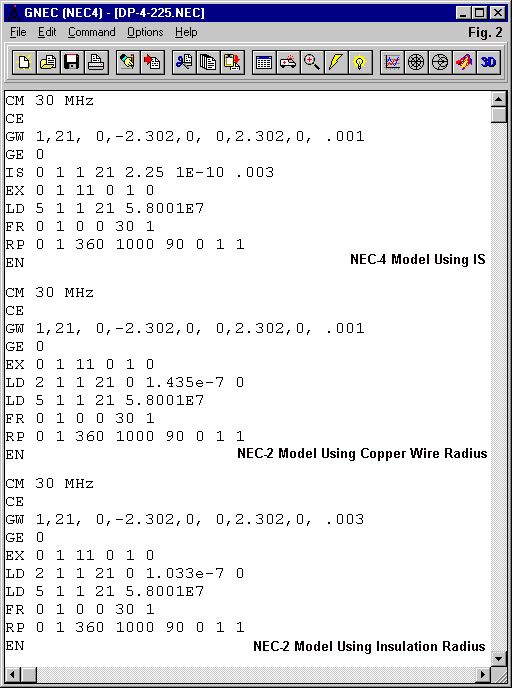
Fig. 2 shows--at the top--the model for a resonant 30-MHz dipole using 2-mm diameter copper wire in free space. In this model, the wire has a 2-mm-thick insulating sheath with a permittivity of 2.25. The model shows the length of the dipole when brought to resonance. The dipole half-length of 2.302 m contrasts to the bare-wire half-length of 2.416 for resonance. The result is a velocity factor of 0.957.
In episode 50, I cataloged a considerable mass of baseline data for the IS command using the 30-MHz dipole. I took three cases involving a 2-mm diameter wire: with 0.5-mm, 1.0-mm, and 2.0-mm thick insulation. I then systematically ran each physical situation through permittivities from 0 through 3 in 0.25 steps. My goal was to develop a series of curves for various ways of looking at the data for the progression of insulation thickness that had a 1-2-4 progression. Part of that work was to develop data on the 30-MHz dipole's resonant length and resonant impedance for each permittivity level.
These two data categories will be useful to us when we examine an alternative means of handling insulated wires that is equally applicable to any form of NEC.
Insulation through LD2
Although NEC-2 does not have anything to equal the simplicity of an IS command, it is possible to simulate the effects of wire insulation by using the LD 2 command. The commands LD 0 through LD 3 specify lumped loads of either series or parallel R-L-C types. (LD 4 is the R-X load, while LD 5 is the command used to specify the conductivity of the wire, where no entry indicates a perfect or lossless wire.) In early episodes of this series, we have worked in detail with the use and limitations of both series and parallel loads that specify the capacitance or the inductance in basic units--the LD 0 and LD 1 commands. However, for most modeling situations, there seems to be little application for the LD 2 and LD 3 commands, which also specify either series of parallel R-L-C circuits. However, these commands use distributed values, specified as farads/meter or henrys/meter.
We shall be employing the LD 2 series circuit, but use only one value: the inductance value in distributed form. The premise is simple: an insulated sheath around a wire acts very much like a distributed inductance along the wire in terms of shortening the required physical length for a given electrical length. Since LD loads are non-radiating, whether lumped or distributed, the use of the LD 2 load has no affect on the performance pattern of the antenna except as the physical wire length has an affect.
The middle portion of Fig. 2 shows the direct substitution of an LD 2 command card for the IS command.
LD         2    1       1         21    0  1.033e-7   0
Command  Type  Tag  Start Seg  End Seg  R      L      C
The expanded version of the LD 2 line identifies the individual entries. Note that for this type of entry, we select all of the segments on the wire to apply the following series R-L-C values uniformly along the length. The value of the required inductance in H/m is in the order of E-07, that is, in the ballpark that surrounds a tenth of a uH/m. The exact amount that I placed in the LD 2 line was the amount required to resonate the dipole at the same length and frequency as the IS card. I called the dipole resonant if the reactance was under +/-0.2 Ohms. By a series of modeling exercises, I was able to replace all of the IS commands from episode 50 with LD2 commands with L/m values for the three cases and for all permittivities from 0 through 3. Then I made a table.
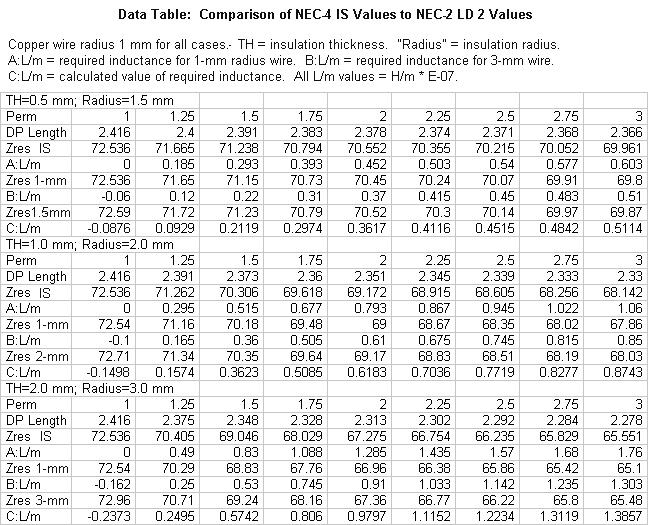
The table actually has more data than we yet have use for, but we may examine most of the lines. The "Permittivity" line in each of the 3 sections lists the range and increments of dielectric constants covered by the exercise. The "DP Length" line shows the half-length in meters. The "Zres IS" line records the resonant impedance or feedpoint resistance for each dipole length and permittivity level.
The next line--"A:L/m"--records the value of distributed inductance required to bring the dipole back to resonance after removing the IS line. The following line lists the resonant impedance recorded from the model that used that specified value of L/m. As you will note, there is a slight but no where close to debilitating difference in the Zres numbers that emerge from the use of the IS command and from the use of the LD 2 command to simulate wire insulation.
You may create from the specified lines of the table a chart that correlates insulation permittivity and thickness on the one hand and usable model values for LD 2 commands to simulate in NEC-2 the increments of insulation covered. 2-mm diameter (1-mm radius; 0.0787" diameter) wire is about half way between AWG #14 (0.0641") and AWG #12 (0.0808"). The indicated L/m value should cover both wire sizes and associated insulation. Remember to use the center portion of Fig. 2 as a model-construction guide. It should especially remind you to multiply each of the values shown in the table by E-07.
You can roughly approximate these values by knowing the insulation thickness, the wire size, and the relative permittivity of the insulation. You can precalculate the required values from the following rough equation:

where L/m is the distributed inductance in henrys/meter, epsilon is the permittivity of the insulation, R is the radius of the wire-plus-insulation, and r is the radius of the wire itself. The equation is especially good for permittivity values between 2 and 3, the normal range of insulation dielectric constant for most wire used by radio amateurs. However, the final constant (2.267) is an average between the lowest and highest values required to cover all of the required values of L/m in the table. Within the range of the table, calculated values at the extremes reach an error of +/-6%. However, a 6% error in the LD 2 command inductance entry still provides a model that is off resonance only by about 3 to 4 Ohms of reactance. Hence, the calculation may still be quite serviceable for practical applications.
The value of L/m actually undergoes an inflation with increases in both the ratio of radii and permittivity. The approximate rate of expansion is roughly equal to the product of those 2 values to the 12th root. So you may obtain a further bit of accuracy by using this variant of the roughest equation:

The use of the expansion factor on the equation's constant results in maximum errors for L/m of less than 2% across the range of calibration. For most combinations of radii ratios and permittivities, the error is less than 0.5%.
Of course, the error notes for equations 1 and 1A are not a comparison to a physical antenna, but a correlation of LD 2 values of L/m to NEC-4 IS results for the range of radii and permittivity in the original table for a 2-mm copper dipole at the test frequency. In both the initial approximation and the version of the equation with the expansion adjustment, the second term ensures that the value of L/m goes to zero when the permittivity goes to 1, the condition of a bare wire. As well, the final term ensures that the value of L/m goes to zero when R and r are equal, again, the condition of a bare wire.
Equations 1 and 1A are ad hoc adjustments of a somewhat different equation developed by Alexander Yurkov, RA9MB. We shall look at his alternative as our next step in providing a substitute for the IS command for NEC-2 users.
The RA9MB/UA3AVR Insulated Wire Simulation
Yurkov took a different tack in developing his modeling aid for insulated wires. He calculated the effect of insulation, taking the entire wire-plus-insulation radius as his basic unit. Examine the lowest model in Fig. 2. Note that the wire radius is not the copper wire radius of 1 mm, but the insulation outer radius of 3 mm. In the LD 2 line, note that the value of distributed inductance is considerably different from the value used in the middle model. (The middle model retained the wire size as originally specified.)

Equation 2 uses the same terms as equation 1. However, the Yurkov adds a term, the square of kabs. The term "kabs" stands for an "absolute velocity factor" and uses the value 0.95 in applications of the equation. Yurkov's original equation also employs a complex first term that he labels µ0. However, Dimitry Federov, UA3AVR, modified the equation for use in NEC models by dividing that term by values that simplified the left-most term of the equation to the form used in equation 2. For further information on the Yurkov equation and its foundations, you may visit http://www.qsl.net/ua3avr/Read_me_Eng.htm.
As an exercise, I took the models used in the first two steps of the data table and modified the GW lines to reflect the larger wire radius required by the Yurkov equation. I then varied the value of "B:L/m" until the dipole was once more resonant for each case and increment of permittivity. I recorded the resulting resonant impedance as "Zres 1.5" (or "Zres 2" or Zres 3", depending upon the case).
The final line of the data table lists "C:L/m," the values of distributed inductance calculated directly from equation 2.
We can summarize the differences between the Yurkov equation and my rough variant in this way. Yurkov's equation is based on solid foundations. However, it requires that the user alter the wire radius from its wire value to a value equal to the insulation radius. For most real cases, that change will make no significant difference to the reported data. However, it does result in a requirement to introduce a negative inductance for permittivity values of 1 and just above 1 in order to restore the dipole to resonance. Thickening the wire changes both the skin effect and the resonant length so as to require a capacitive reactance for resonance with the fixed dipole lengths used. Note that NEC will handle at least small values of inductance in negative numbers. On the other hand, my initial rough equation has a narrower range within which it yields accurate values, although the version including expansion is at least as accurate as the Yurkov equation over the test range in correlations with the results of NEC-4 models using the IS command. In addition, equations 1 and 1A retain the original wire radius in the model. Which version you employ will make little difference practically and may well turn out to be a function of which equation you are most comfortable solving and which modeling technique (applying the original or the adjusted wire radius) you are most comfortable using.
How Confident Should We Be in the NEC-2 LD 2 Simulation of Insulated Wires?
Tabular data often does not lend itself to evaluations indicated by our lead question. Perhaps we can better judge our confidence level in the Yurkov substitution method by graphing the data. Note that we have no external baseline of empirical data. So we shall be comparing the results obtained by the NEC-4 IS command with the substitute methods of handling insulated wires. We shall proceed on a case-by-case basis, beginning with the thinnest insulation.
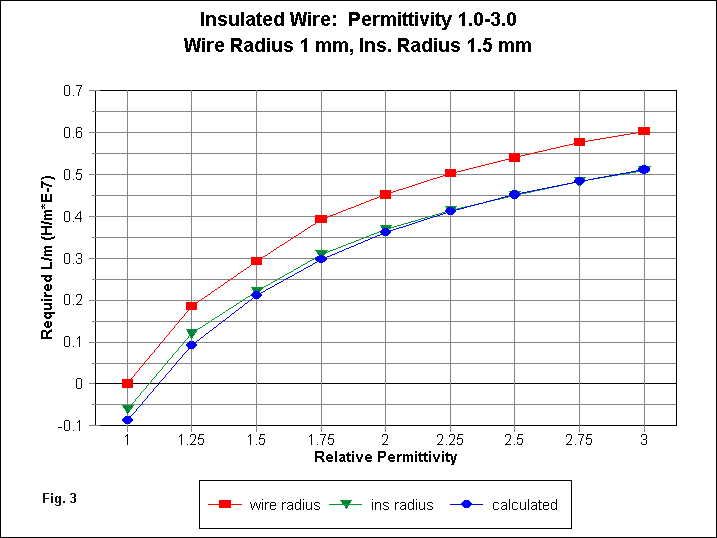
Fig. 3 has 3 lines. The redline indicates the required values for L/m to restore the dipole to resonance based on the original use of the IS command in NEC-4. These values are based on retaining the specified wire radius as it was in the original NEC-4 IS model. The green line indicates the values of inductance required if we increase the wire radius to the value indicated by the insulation radius. In this case, the radius increases from 1 mm to 1.5 mm. The blue line records the values of L/m calculated from the Yurkov equation.
Two trends are equally important in this graph. First, all three curves are closely parallel, indicating the general validity of either procedure in simulating an insulated wire. However, at very low values of permittivity, the enlarged conductor radius of the Yurkov method results in required values of L/m that are less than zero. This situation represents a limit to the application of the Yurkov equation, since a permittivity of 1 should yield the same results as a bare wire (under the condition that the conductivity is so low as to be negligible). However, most applications will never encounter this situation.
The second trend involves the modeled values of L/m and the values of L/m calculated from the Yurkov equation. The two lines are too close together to yield differences in modeling results that could be called significant.
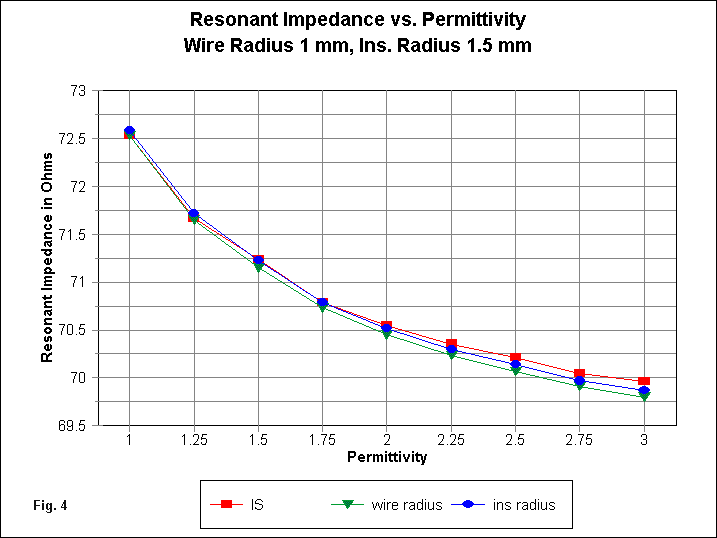
Fig. 4 tracks the 30-MHz dipole resonant impedance under three conditions. The red line indicates the resonant impedance using the original NEC-4 model with the IS command. The green line indicates the resonant impedance using the 1-mm radius wire and the associated LD 2 command entries. The blue line provides values of resonant impedance using the increased radius and the required values of L/m in the LD 2 command. The three lines correspond to the upper, middle, and lower models in Fig. 2.
Perhaps the most telling note that we can make for this graph is this one: at widest divergence, the modeled resonant impedance values vary among all three lines by less than 0.25-Ohm relative to a median value of nearly 70 Ohms.
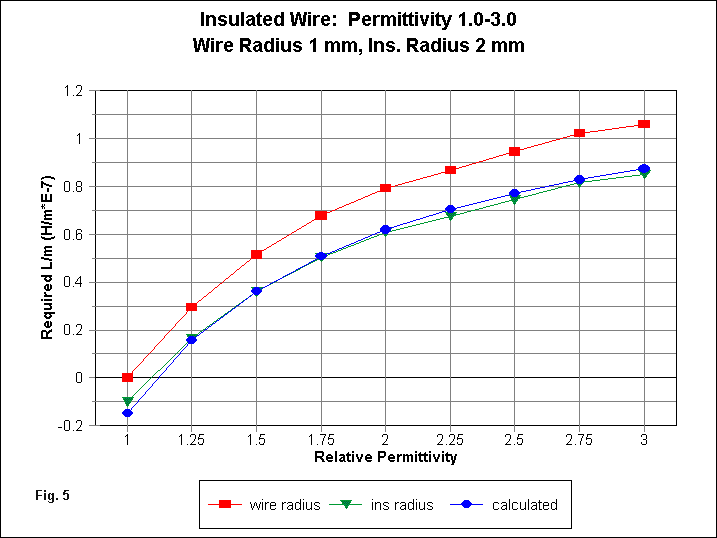
Fig. 3 and Fig. 4 tracked the data for the thinnest insulation--0.5 mm. Fig. 5 and Fig. 6 track the data for the next level of insulation thickness: 1.0 mm. Fig. 5 provides information on the values of L/m for the same three situations described for Fig. 3. Once more, the curve for the 1-mm wire parallels the curves for the 2-mm wire, with the latter pair of curves dipping below an L/m value of zero for the lowest permittivity level. Again, the calculated and modeled values of L/m for the Yurkov case are too close together to represent any significant difference.
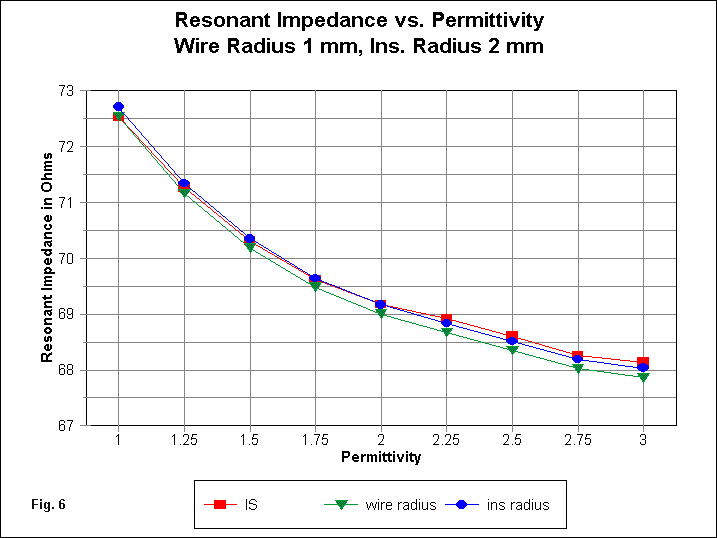
Fig. 6 tracks the three defined resonant impedance cases, in parallel to Fig. 4, but for the middle insulation thickness. Once more, the three lines are within about a quarter-Ohm of each other at their widest divergence. However, there is a systematic variance between the values that emerge from using the IS command and those emerging from use of the LD 2 simulation when using the same wire radius in the GW line. This condition suggests a difference between the two methods for simulating the effects of insulation, but not a difference that should create a level of variance that has practical implications for the average wire antenna builder.
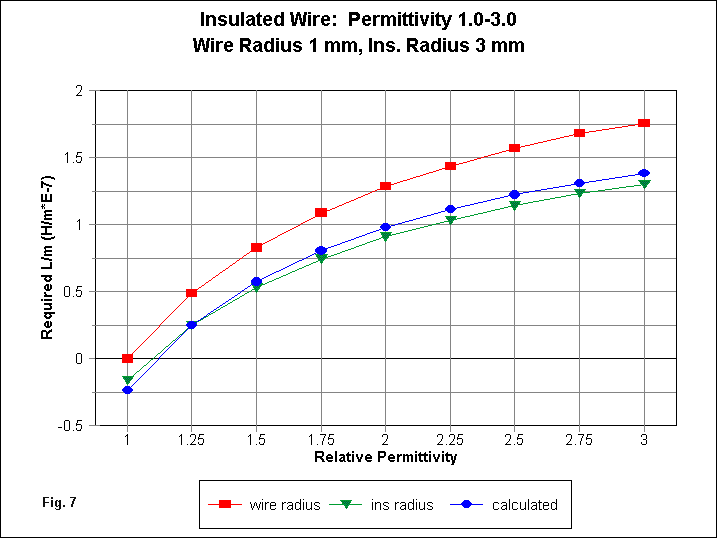
Fig. 7 and Fig. 8 track the same two data sets for the thickest insulation: 2 mm. The L/m traces show the same parallel development. However, the values calculated from the Yurkov equation and the values required by the model to restore the 3-mm radius wire to resonance begin to diverge at both ends of the permittivity range covered. The final set of values for the green and blue lines at a permittivity of 3 differ by about 6%. However, for the 30-MHz dipole, that divergence yields an impedance that is off-resonance by only about 3.5 Ohms of reactance. For practical applications, construction variables would normally mask this difference.
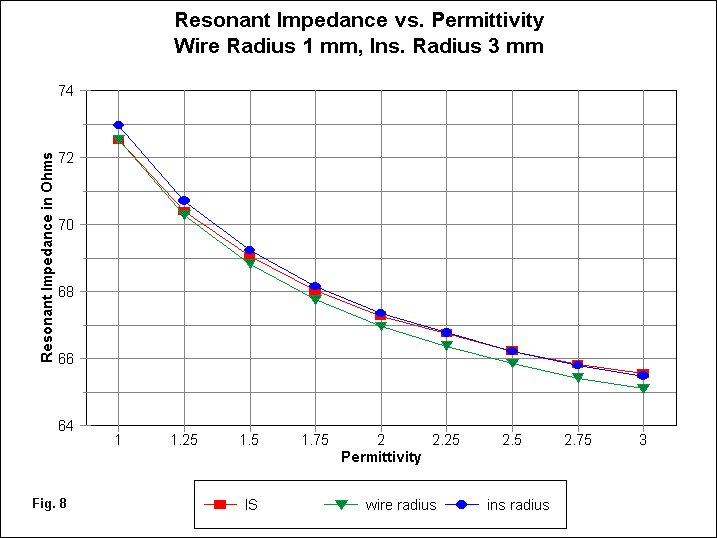
In Fig. 8, we have the traces for the three resonant impedance situations: the original IS model, the direct substitution of an LD 2 command for the IS command, and the use of the insulation radius as in the Yurkov equation. The latter two cases parallel each other with a maximum separation of about a third of an Ohm. Interestingly, the original IS model shows resonant impedance values that begin by tracking the direct replacement model and end by tracking the Yurkov model.
Conclusion
We began the series of graphs with the question of to what degree we might have confidence in using either equation 1 (or 1A) or equation 2 as NEC-2 substitutes for the IS command that is available in NEC-4. Over the range of tests covered by this exercise, the general answer is that we can have high confidence in the use of the LD 2 simulation for virtually all practical applications. It yields results that are--to a high degree--consistent with those produced by the NEC-4 IS command.
However, we need to enter a caution here. These initial tests cover only a single dipole. They do not cover all frequencies at which we generally use insulated wire for antennas--generally the HF range. Nor do the tests cover closed loops. These notes are not designed to fully validate the method, but only to show some of the procedures that might be used to validate the method for a given modeling situation. As well, these notes do not validate the substitute method against the physical realities of antennas, but only against the NEC-4 results when using the IS facility.
We should also be aware of a second caution. We noted that equation 1 shows about a 6% potential error in the value of L/m at the extremes of its range of application. Equation 1A, of course, shows a much lower level of potential error, a maximum of 2% for the test range. The Yurkov equation shows limitations at the upper end of application to the same degree as equation 1. At the lower end of application--with very low values of permittivity--it also has a limit. Within the range of insulation thicknesses used in this exercise and within the range of permittivities covered, the limitations are no barrier to practical applications. Indeed, practical values of both insulation permittivity and insulation thickness generally fall within the limits of the exercise.
There are, however, specialized applications that fall well outside the limits of the exercise. The general confidence that we can place on these simulation techniques may not carry over to such applications. Since both equations show trends toward divergence from the IS command models at the extremes of the test range, it is probable that further divergence will appear as we move well outside the test range of values. Hence, all such applications would require independent validation of whatever modeling technique is used to simulate insulated wires against the physical realities of antenna construction. -30-
~ antenneX January 2005 Online Issue #93 ~
Click for Biography of Author
